
An unseasonably warm air mass will challenge winter heat records in central Australia over the coming week, with temperatures set to climb more than 15°C above average for this time of year.

This month we have been exploring the topic of climate tipping points and provided an overview of the subject in an earlier blog post. In this post, we look more closely at the impacts of potential tipping points on UK weather and climate.
Risk assessment
Understanding the impact of tipping points is an important element of climate change risk assessment, and a Met Office report was produced on impacts to the UK for input to the Third Climate Change Risk Assessment (CCRA3) Technical Report. In this report, three classes of Earth system instabilities were considered – those that could affect the UK directly through changes in our regional weather and climate; those involving changes in land ice, affecting sea level rise impacts in the UK and worldwide; and those related to feedbacks involving carbon or other biogeochemical cycles (e.g., the water cycle). Here we focus on some of the key instabilities which are likely to have the greatest impacts in the UK if tipping points occur.

Atlantic Meridional Overturning Circulation (AMOC)
The AMOC is a system of ocean currents which redistributes heat and carbon throughout the climate system and is responsible for a mild climate in the UK. Some studies suggest that the AMOC could have a tipping point, with evidence that the circulation has collapsed into a state of reduced flow in the distant past, from climate records taken from geological and biological materials such as sediment and tree rings. Although it is believed unlikely that the AMOC will collapse before 2100, there is scientific uncertainty around this, and a collapse could cause significant and widespread impacts across the UK, Europe and beyond. UK and European impacts are explored in the latest Marine Climate Change Impacts Partnership Ocean Circulation report.
Changes in temperature, wind and rainfall patterns as well as increases in storm surges would have wide implications for the UK such as impacts on agriculture, marine industries and renewable energy production. High wind speeds can cause damage to wind turbines, whilst colder temperatures in winter could have human health impacts and increase energy demand.
Sea level rise
There are two major contributors to sea level rise globally – thermal expansion of water as oceans warm, and an increase in the amount of water in the ocean as ice sheets and glaciers shrink. Of these, increasing water mass accounts for two thirds of sea level rise totals, and a large component of this is due to the accelerating loss of major ice sheets in Greenland and Antarctica. The Met Office climate dashboard provides a comprehensive way to stay up to date on the current state of the climate by providing data based on observations of key global climate indicators including sea level rise. We will also look in more detail at sea level rise tipping points later this month.
Of most concern for the UK in terms of sea level rise is the risk of abrupt change to the West Antarctic Ice Sheet. Current climate projections indicate up to ~1m rise in sea level around the UK by 2100. Under certain circumstances, melting of the ice sheet can rapidly accelerate, and reaching these tipping points could cause ice sheet collapse. This irreversible shrinking of the ice sheet would commit the UK and the world to a much faster rate of sea level rise – up to 2m in the UK this century and even higher sea level rise beyond 2100.These scenarios are included in what are known as H++ scenarios – low likelihood but plausible extreme possibilities for future sea level rise.
Rising sea levels can cause a range of impacts; changing the shape of our coastline and beaches, and threatening infrastructure and the homes of people who live in coastal communities. Rising sea levels can also threaten the survival of already fragile wildlife habitats.
North Atlantic Jet Stream
The North Atlantic jet stream is closely linked to UK weather patterns and there is concern that this could weaken or change position due to a reduction of Arctic sea ice. The position and strength of the jet stream can alter the frequency and/or magnitude of high‐impact or extreme weather events in the UK. There is, however, scientific uncertainty about the likelihood of changes to the jet stream and the exact nature of the impacts which would be experienced. As impacts could have notable implications for the UK’s weather and climate, research in this area is important to fill those knowledge gaps.
Indirect impacts
Other tipping points may also have indirect impacts for the UK weather and climate. For example, a significant decrease in size of forests such as the Amazon rainforest would reduce the efficiency of terrestrial carbon sinks – which absorb more carbon from the atmosphere than they release – leading to increased atmospheric concentrations and accelerated global warming. This is turn could cause a cascade of further tipping points as well as other impacts associated with a warming climate.
Impacts of other tipping points around the world could also impact the UK indirectly due to socio-economic instability generated by climate changes elsewhere in the world.
Taking action
Mitigating against a changing climate by reducing greenhouse gas emissions is critical to limiting warming which would help us avoid the worst impacts of climate change, including those which could be caused by reaching tipping points. Some of these impacts will be irreversible and if they happen before emissions are reduced, we will be committed to that impact in the future.
We also need to adapt to the climate changes we are already seeing and the changes that are expected in the coming decades to make sure we avoid the worst impacts. While crossing major climate tipping points may be unlikely, it is important to understand the wider impacts and risks if they were crossed and to develop early warning indicators that would allow society time to respond.
Action is required across all levels of society – to find out more about how you can make a difference, take a look at our Get Climate Ready webpages.
Follow the #GetClimateReady hashtag on X (formerly Twitter) to learn more about tipping points this month.

We all look out the window to see what the weather is up to. In a similar way, MetService meteorologists are always checking to make sure what they have predicted is actually happening.
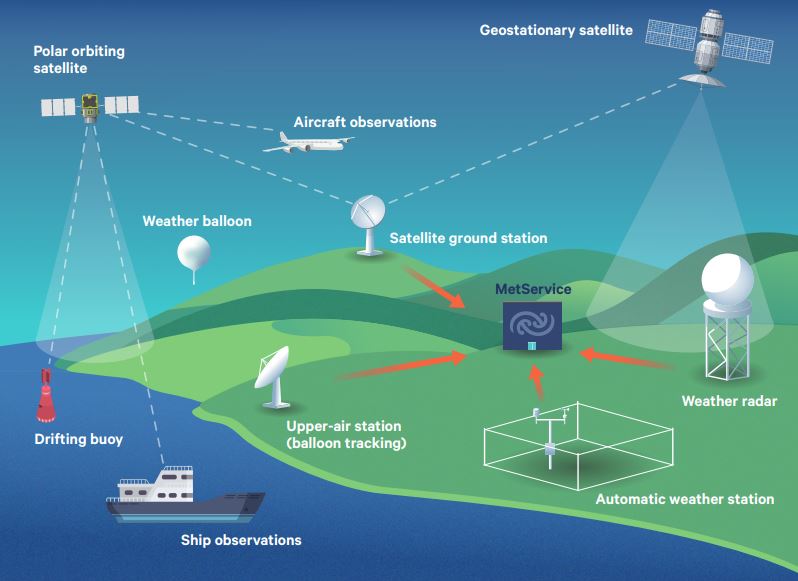
The forecasters may not be examining the skies themselves every few minutes, but they are monitoring a network of instruments across Aotearoa New Zealand, including those sited on our sub-tropical and sub-Antarctic islands, which are constantly feeding back crucial information to the National Forecasting Centre.
Wind direction, wind speed, air temperature, humidity, rainfall, air pressure, cloud, and visibility, etc. – all these observations and data help build a picture of what is going on. But they can’t just be measured from anywhere.
For example, temperature readings taken above or next to a concrete or asphalt surface in a confined space will read several degrees higher than those taken in a grassy location which is better ventilated. While those exaggerated temperatures may be a true reflection of that super-heated spot, they do not represent those of the entire neighbourhood.
Accurate and reliable weather observations that are consistent with the standards of the World Meteorological Organization from around the motu are the bedrock on which good forecasts are based. MetService has a dedicated team who ensure that all our automatic weather stations operate to world standards, and that the observations from our observing network are quality controlled and delivered reliably to the forecasters.
Precise observations do more than tell meteorologists if the weather is unfolding as they had forecast in a certain situation. They are essential as an input to start the computer models which use complex mathematical equations to predict how weather systems will move, form and decay. In other words, the observations are critical to describe the weather now so that models can accurately step forward in time providing our forecasts and warnings. Most importantly the data keeps the computer weather models ‘true’ and in line with what is actually happening with the weather.
Thinking in 3D
We know the Earth’s atmosphere is not two-dimensional, which means observations of temperature, wind and air pressure are not just needed from the surface of the Earth but also right up through the lowest slice of the atmosphere, known as the troposphere, which contains nearly all of our weather.
At Aotearoa New Zealand’s latitude, the troposphere reaches an altitude of about 12km above the surface. Within this layer, large weather balloons carrying radiosonde equipment take regular measurements during their ascent. MetService operates four upper-air sounding stations, at Invercargill, Paraparaumu, and Auckland and one in the Kermadec Islands 1000km northeast of Auckland where these balloons are released once or twice a day.
Pilots flying aircraft at high altitude also pass on observations of wind, temperature, and turbulence to assist meteorologists with their predictions.
Even higher up, weather satellites provide important measurements of moisture and temperature in the atmosphere. MetService meteorologists have access to data from the Japanese geostationary satellite Himawari-8 which effectively provides a photo from space every 10 minutes, so they can see how weather systems develop and move.
On the ground and at sea
MetService has an extensive weather radar network of 10 radars, from Kerikeri in the north to Invercargill in the south. Radars are extremely useful tools for monitoring the movement and intensity of rain, hail, and snow, and are particularly valuable when lives are at risk from severe thunderstorms or for immediate information of rainfall rates in an area with no surface observation. Radars are also vital when tracking a severe thunderstorm cell when the heavy downpours from it could cause flooding.
To complement radar information, forecasters use observations from Transpower’s National Lightning Detection Network to pinpoint where lightning from the severe thunderstorms reaches the ground.
It’s not only the land and the sky which MetService has covered. Ships which travel around our coasts and to and from Aotearoa send through useful observations of the weather conditions out at sea. And a network of drifting buoys in the Tasman Sea provides vital data on developing systems before they reach our shores.
Our observations
Until a few decades ago, surface observations were made manually by people around the country, on farms, at airports, in lighthouses and the like. Some of MetService’s stations have been in operation for more than 100 years – the longer a consistent record the better from a climatological perspective.
Now, most observations come from more than 220 automatic weather stations (AWS) in all corners of Aotearoa New Zealand, which provide data every 60 seconds and are extremely efficient, operating more than 99% of the time. In addition to being used by weather forecasters, data from these stations also feed into the National Climate Database.
As well as operating its own AWS network MetService also partners with other organisations that have networks of stations. MetService also has more than 50 AWS units monitoring road conditions for Waka Kotahi on our state highways and provides Airways Corporation with airport weather conditions at airport control towers across the country.
As well as the observations keeping meteorologists up to date with what they are dealing with, they assess how well the global computer models are performing in the Aotearoa New Zealand region.
We need you!
There’s one other source of weather observations we haven’t covered yet – you! Public feedback and photos via social media and the WOW observations, where members of the public with weather stations can add the information to the WOW map on the MetService website, are extremely helpful.
MetService also calls for snow observers each year and asks for photos and videos from the public to help verify the strength of tornadoes and to share the impacts that severe weather has on our nation.
Keep looking out your window and let MetService know what is happening in your own backyard.


.")

Throughout autumn and winter there have been a number of sightings of the Northern Lights, or the aurora borealis, in the UK. As 2024 continues, the question for many space weather experts is when we’ll see a peak in the Sun’s activity as part of this solar cycle.
The auroras on Earth, which are most commonly seen over high polar latitudes but can often spread south to be visible over parts of the UK, are chiefly influenced by geomagnetic storms which originate from activity on the Sun.
Space weather forecasters, like those who work at the Met Office Space Weather Operations Centre (MOSWOC), spend their time studying the Sun’s activity and forecasting the arrival of coronal mass ejections which cause geomagnetic storms, solar flares and solar radiation storms, collectively known as space weather. Space weather typically originates from sunspots on the Sun’s surface.

While these events contribute to the magnificent displays of colours in the sky as part of the auroras, the most severe of these events also have the potential to cause radio blackouts, disrupt GPS systems and interact with some ground-based infrastructure on Earth.
Forecasting of specific events is incredibly complex, with satellites looking at features on the Sun including sunspot activity on the Sun’s surface from around 93million miles away. However, the Sun has a natural rhythm, called the solar cycle, which drives varying levels of activity, with the next peak due in 2024. This cycle works on around an 11-year cycle from one solar maximum to the next maximum.
Met Office Space Weather Manager Simon Machin explained: “While the solar cycle doesn’t help determine specific space weather events, what it does is help our forecasters understand the context of their forecasts.
“In its simplest terms, the solar cycle is linked to the number and intensity of sunspots that are visible on the surface of the Sun. This affects the likelihood of space weather events impacting the Earth.”
When will the solar maximum be?
The last solar minimum, when the Sun’s activity was at its lowest in the cycle, occurred in December 2019, with the Space Weather Predictions Center (SWPC) now predicting that the solar maximum will occur in 2024.
However, as Simon explains, the passing of solar maximum doesn’t mean that further space weather events won’t occur.
“One of the curious things about the solar maximum is that it’s not possible to declare it has occurred until after it has happened and when you observe that reduction in sunspot activity,” said Simon.
“We know that the solar maximum increases the chances of space weather events impacting the Earth, but even as you move away from it as get through 2024 into 2025 and beyond, the Sun will continue to emit solar flares and geomagnetic storms. This means that further auroral displays are likely, as well as an ongoing chance of potentially impactful space weather events, even as we move towards the next solar minimum.”
MOSWOC is one of a handful of 24/7 space weather prediction centres around the world, constantly looking for signs that the Sun’s activity could impact the Earth. By providing warning of these events reaching the Earth, mitigations can be taken by key industries to avoid some of the most severe impacts from extreme space weather events.
Find out more about the Met Office Space Weather Operations Centre or view the latest Met Office Space Weather forecast.
Accurate weather forecasting requires three key ingredients – trustworthy observations, reliable computer models and experienced meteorologists.
Before the computer age and the satellite era, forecasters were reliant on weather observations from land stations, ships, and balloon soundings from which they could predict the movement of high and low-pressure systems and fronts.
Computer modelling has completely changed the forecasting game during the past three or four decades. Most of the MetService forecasts you read on the website or see elsewhere are the result of highly trained meteorologists studying a range of different models and deciding which ones, or which combination of them, are picking the most likely future weather outcomes.
These computer models have an endless appetite for crunching mind-blowing amounts of data.
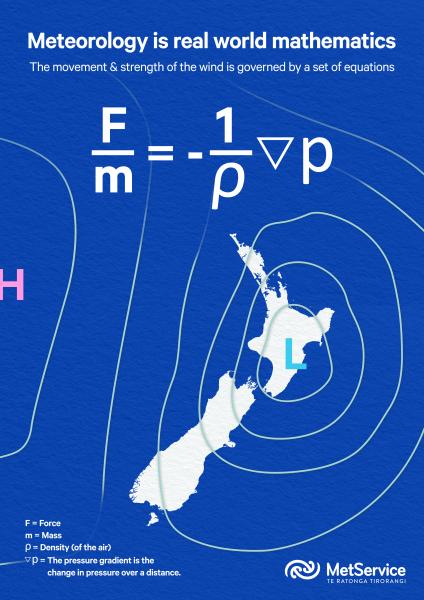
(Above: One of the many equations used to help model the atmosphere)
How do they do it?
Observations are taken from as many sources as possible, right across the planet. All these figures are fed into the models, which use complex mathematical equations reflecting the physics of the atmosphere to produce simulations of its possible future evolution.
Each model has its own personality, its own strengths, and weaknesses in covering our part of the world. This is where the experience of the forecasters and their geographical knowledge comes in, determining which weather situation from which model is the most likely to come true and how it will be influenced by local conditions and features such as Cook Strait and the Southern Alps.
At MetService, we use several of the most-respected global weather models to aid our forecasting.
Probably the most consistent is the European Centre for Medium-Range Weather Forecasts (ECMWF) model, generally recognised as the best-performing of the global models. As well, we consider runs of the UK Met Office model, which is very good when it comes to predicting the development and movement of mid-latitude weather systems.
The GFS model, generated by the National Centers for Environmental Prediction (NCEP) in the United States, is also consulted, although this is perhaps not as steady and reliable in this part of the Pacific as the ECMWF model. On top of that, we get modelling from meteorological services in Canada and Japan, and from the Bureau of Meteorology in Australia.
We also run our own in-house models to simulate the turmoil of the atmosphere and can operate these at much higher resolutions to reflect the idiosyncrasies of Aotearoa New Zealand’s landscape. We can run these with data points just 200 metres apart, which takes into account the different terrain of an area and whether it is forested or urban, which can make a significant difference to temperature and winds across a short distance.
Are they any good though?
The models themselves are constantly being tweaked by their operators to reflect the latest research findings and to keep up with new technology. The users of the models are also changing what they require from them.
In recent months there has been some discussion about whether climate change may be affecting the running of the models and especially their outcomes. Is it possible that an increasing number of more extreme events are pushing the models beyond their comfort zones into unknown territory?
The jury is still out on this. One thing that is for certain is that the basic physics of the atmosphere, on which the models are constructed, has not changed.
What has changed, though, is how often the conditions that lead to extreme weather are now occurring in our warming world. So, the models which are really good at picking bog-standard weather are being asked to deal with potentially severe weather situations more often.
What about Artificial Intelligence?
Like in any other industry, it is hard to predict just how machine-learning and artificial intelligence will affect weather forecasting.
AI-informed weather models have recently been found comparable to, or have even out-performed, physics-based models. But these AI-informed weather models aren’t coming in cold – they are first ‘trained’ on the physical models and then add a layer of prediction on top.
Then of course there remains the task of interpreting what the output of such a system might mean for the activities or safety of end-users.
At MetService we continue to work with the operators of modelling systems to ensure we get the best from them, while continuing to develop our in-house models. We have a keen eye on developments in the AI field and the opportunities it will bring. At the same time, we continually improve our forecasting expertise, which includes an understanding of the strengths and weaknesses of any modelling system.
By doing so, we will be in the best position to identify the risks future weather may bring, and how these are best communicated to those concerned.
Next Page of Stories